In this guide, you'll learn how to visualize and manipulate data from your Marty's sensors using the Sensor Dashboard.
Introduction
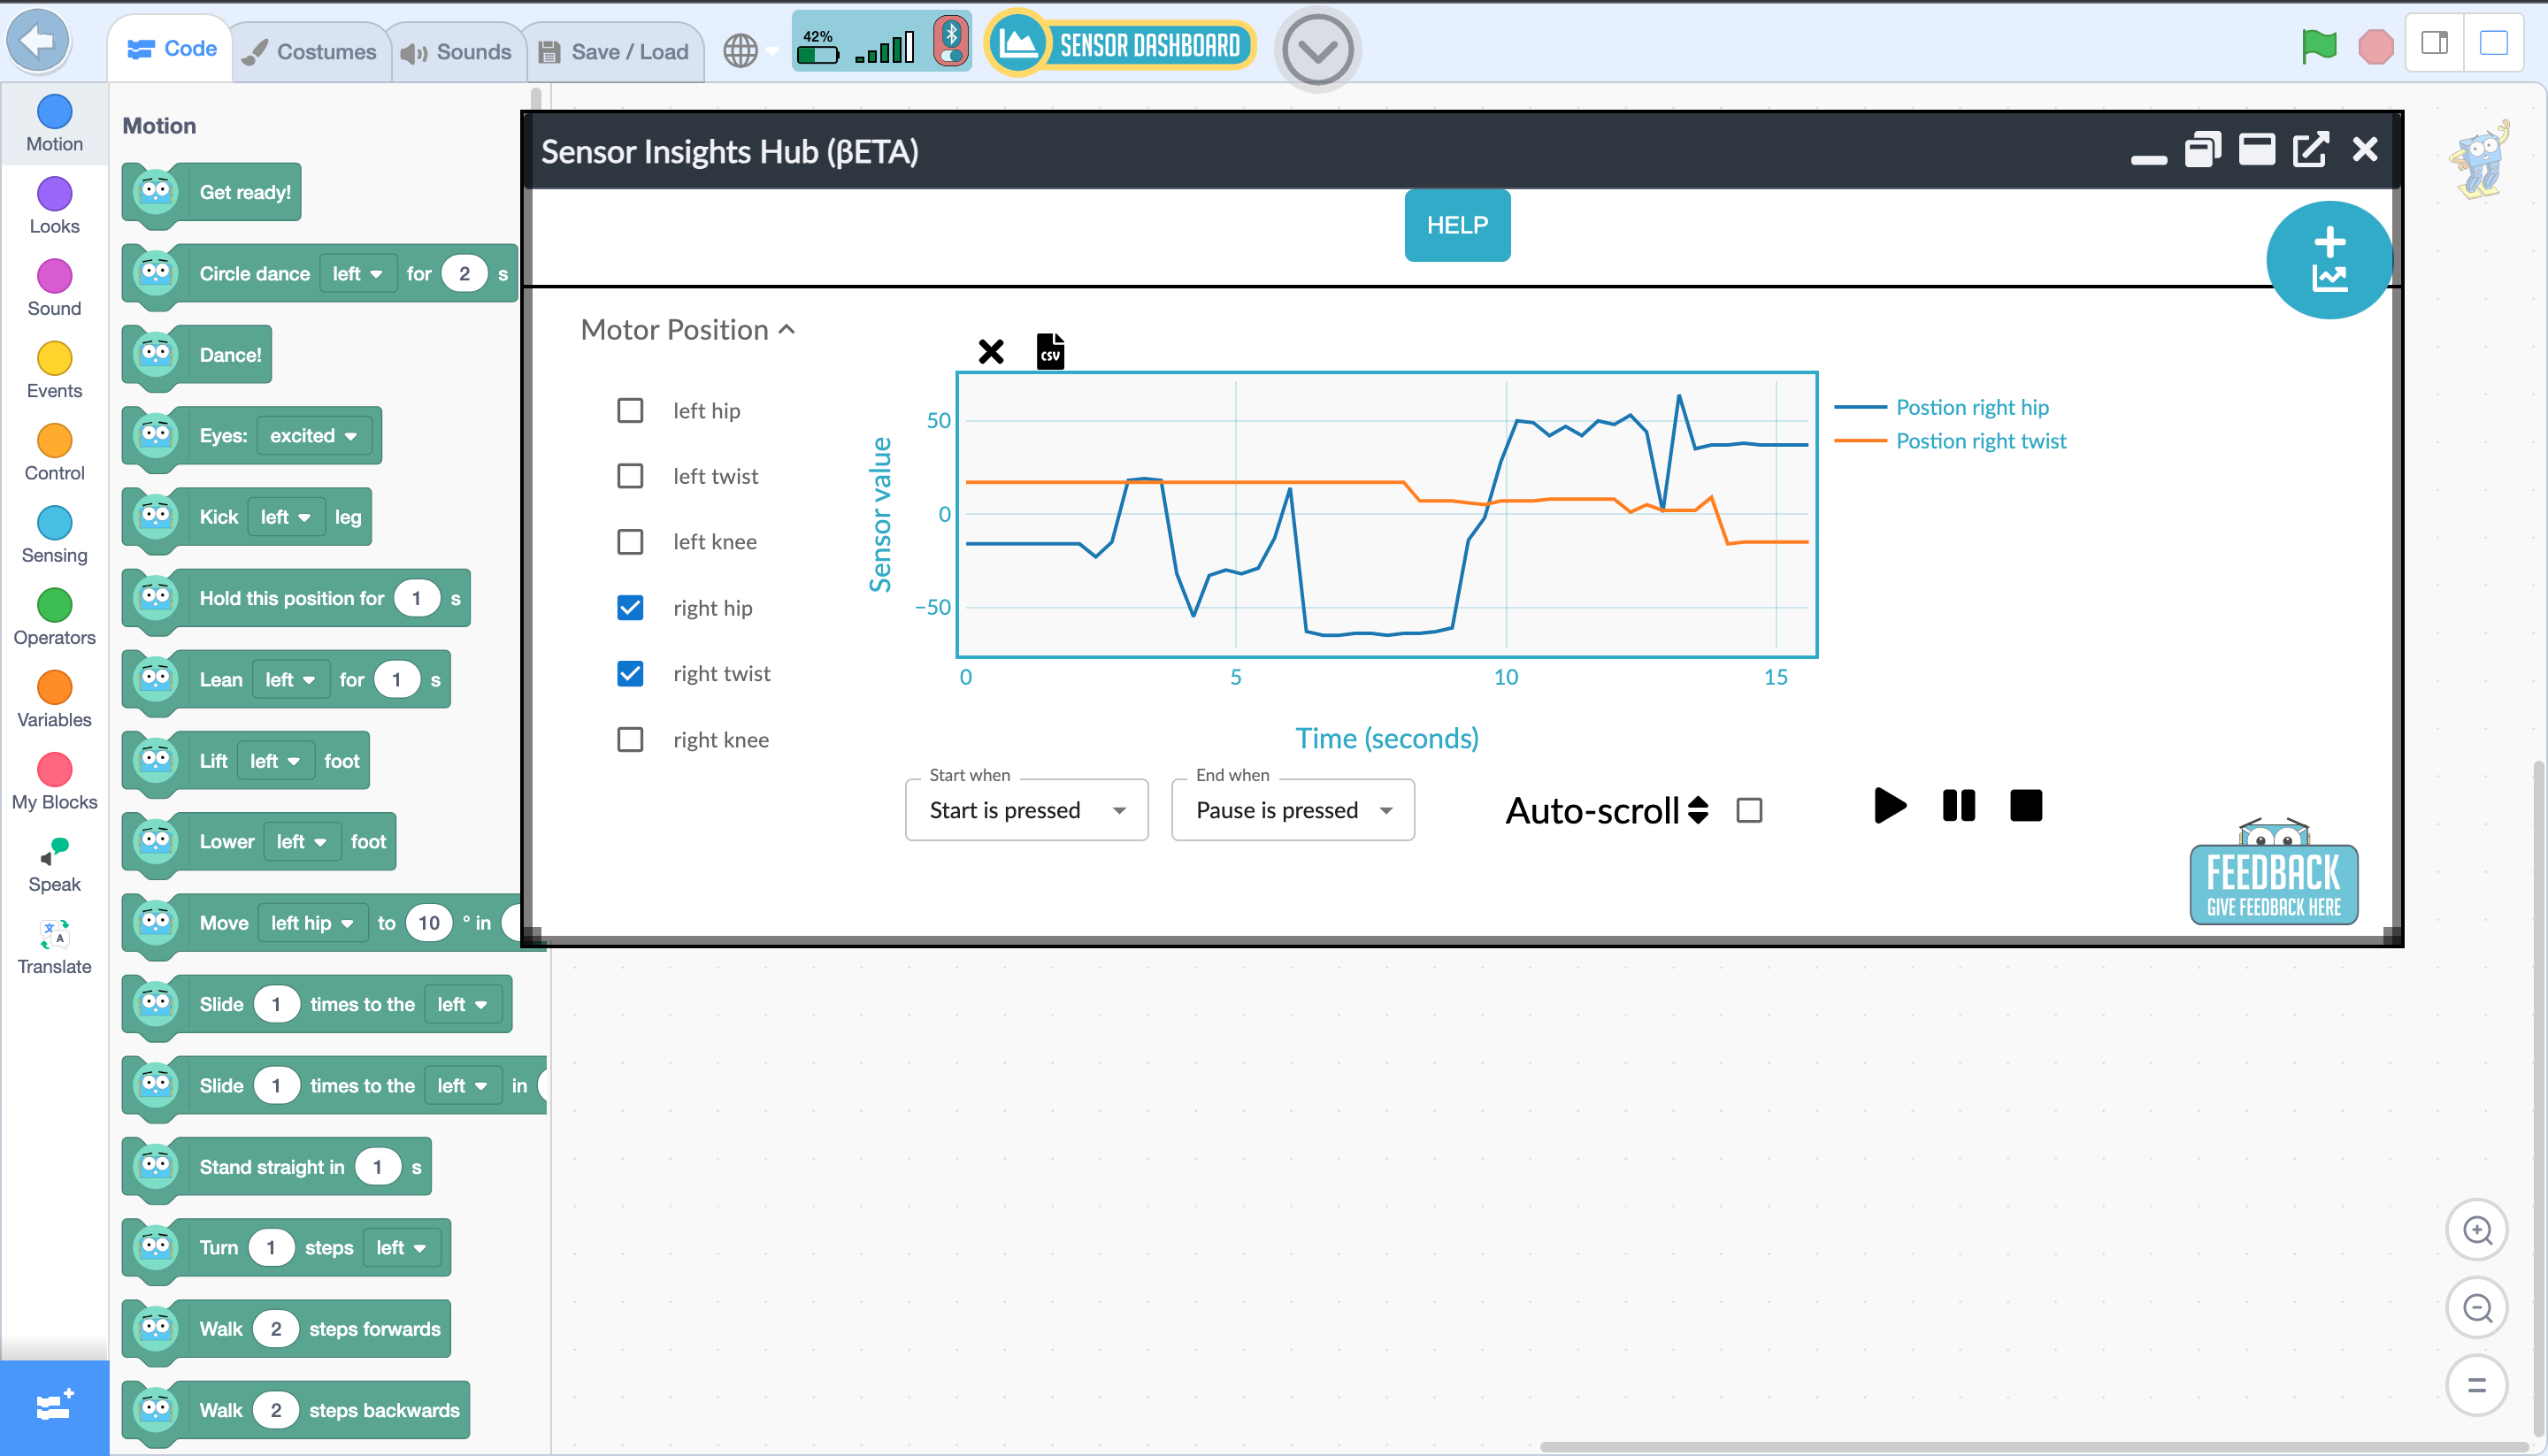
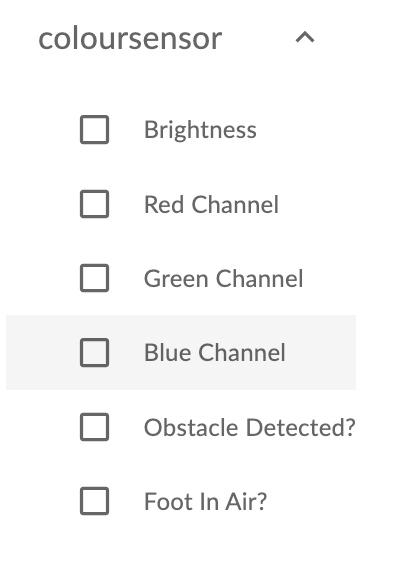
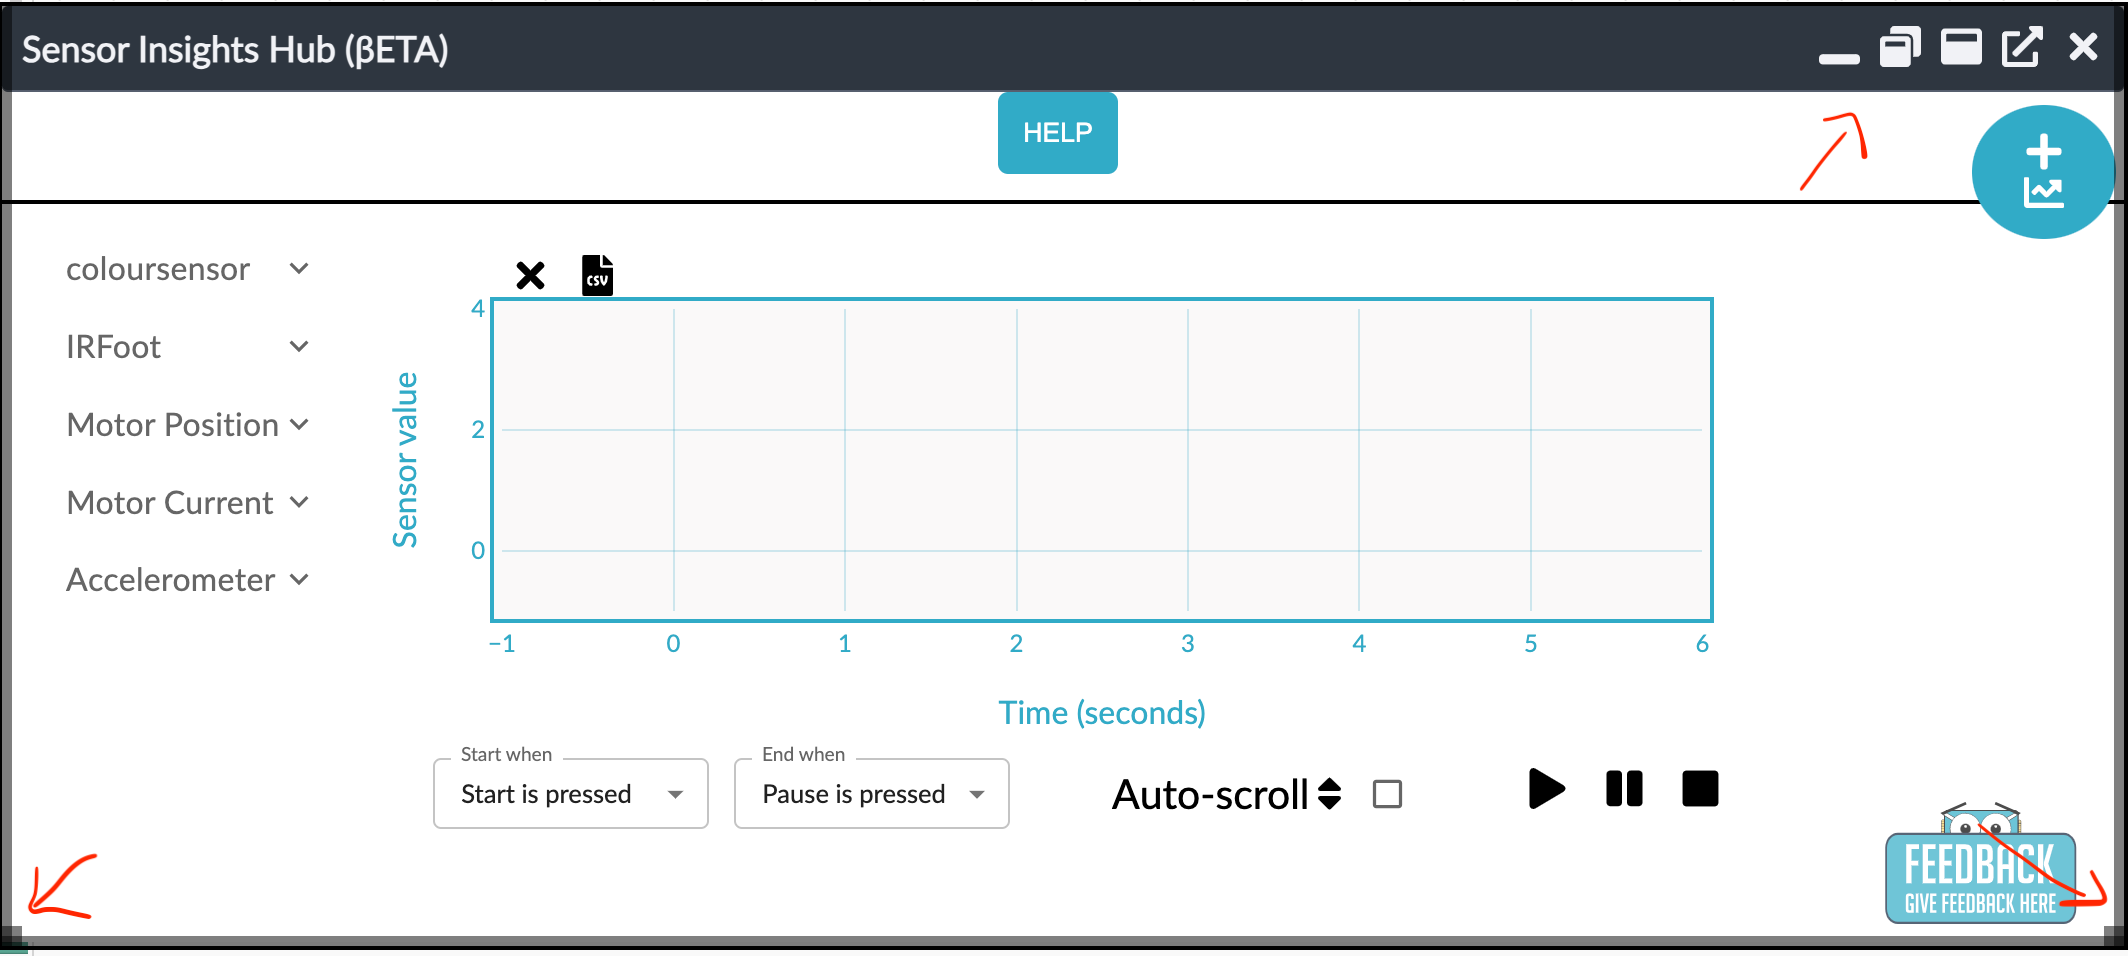
Once you've connected your Marty, an empty graph will be displayed on the screen. To the left, you will see a list of sensors, each of which can be expanded to reveal individual input streams. For instance, the color sensor includes Red, Green, Blue, and Clear input streams. Want more graphs? Simply click on the button in the top right corner. This will generate a new, customizable graph for you to configure with the input streams from any available sensors.
Recording Data
To start collecting data, pick at least one input stream and press the Play button on the bottom left of the graph. A round, black indicator will appear, signaling that you're now live-recording data! The data will plot onto the graph in real-time as it's received from Marty.
Conditional Start/End Events
For certain input streams, you can opt to display data only when particular conditions are met. Simply select your input stream, and if it supports conditional display, a 'Start/End when' list will be available at the bottom right of the graph, showing all available conditions for that stream. Select your condition and press Play. The data will start to plot once the “Start when” condition is fulfilled.
Export data/Capture graph
To export your data in .csv format, click on the 'Export CSV' link on the top left side of the plot. Want to capture a screenshot of your plot? Hover over the graph and click on the 'Download plot as PNG' button that appears on the top right. Happy data visualizing!
Portable window
The Sensor Dashboard opens up as a portable window from within Marty Blocks. The dimensions of this window are adjustable and can be controlled by the control buttons of the top right corner of the window, as well as the 2 bottom corner of the window.
Sensor Terminology
In this section, we'll provide brief definitions of the sensors and their properties. These definitions also exist in the Help section of the Sensor Dashboard.
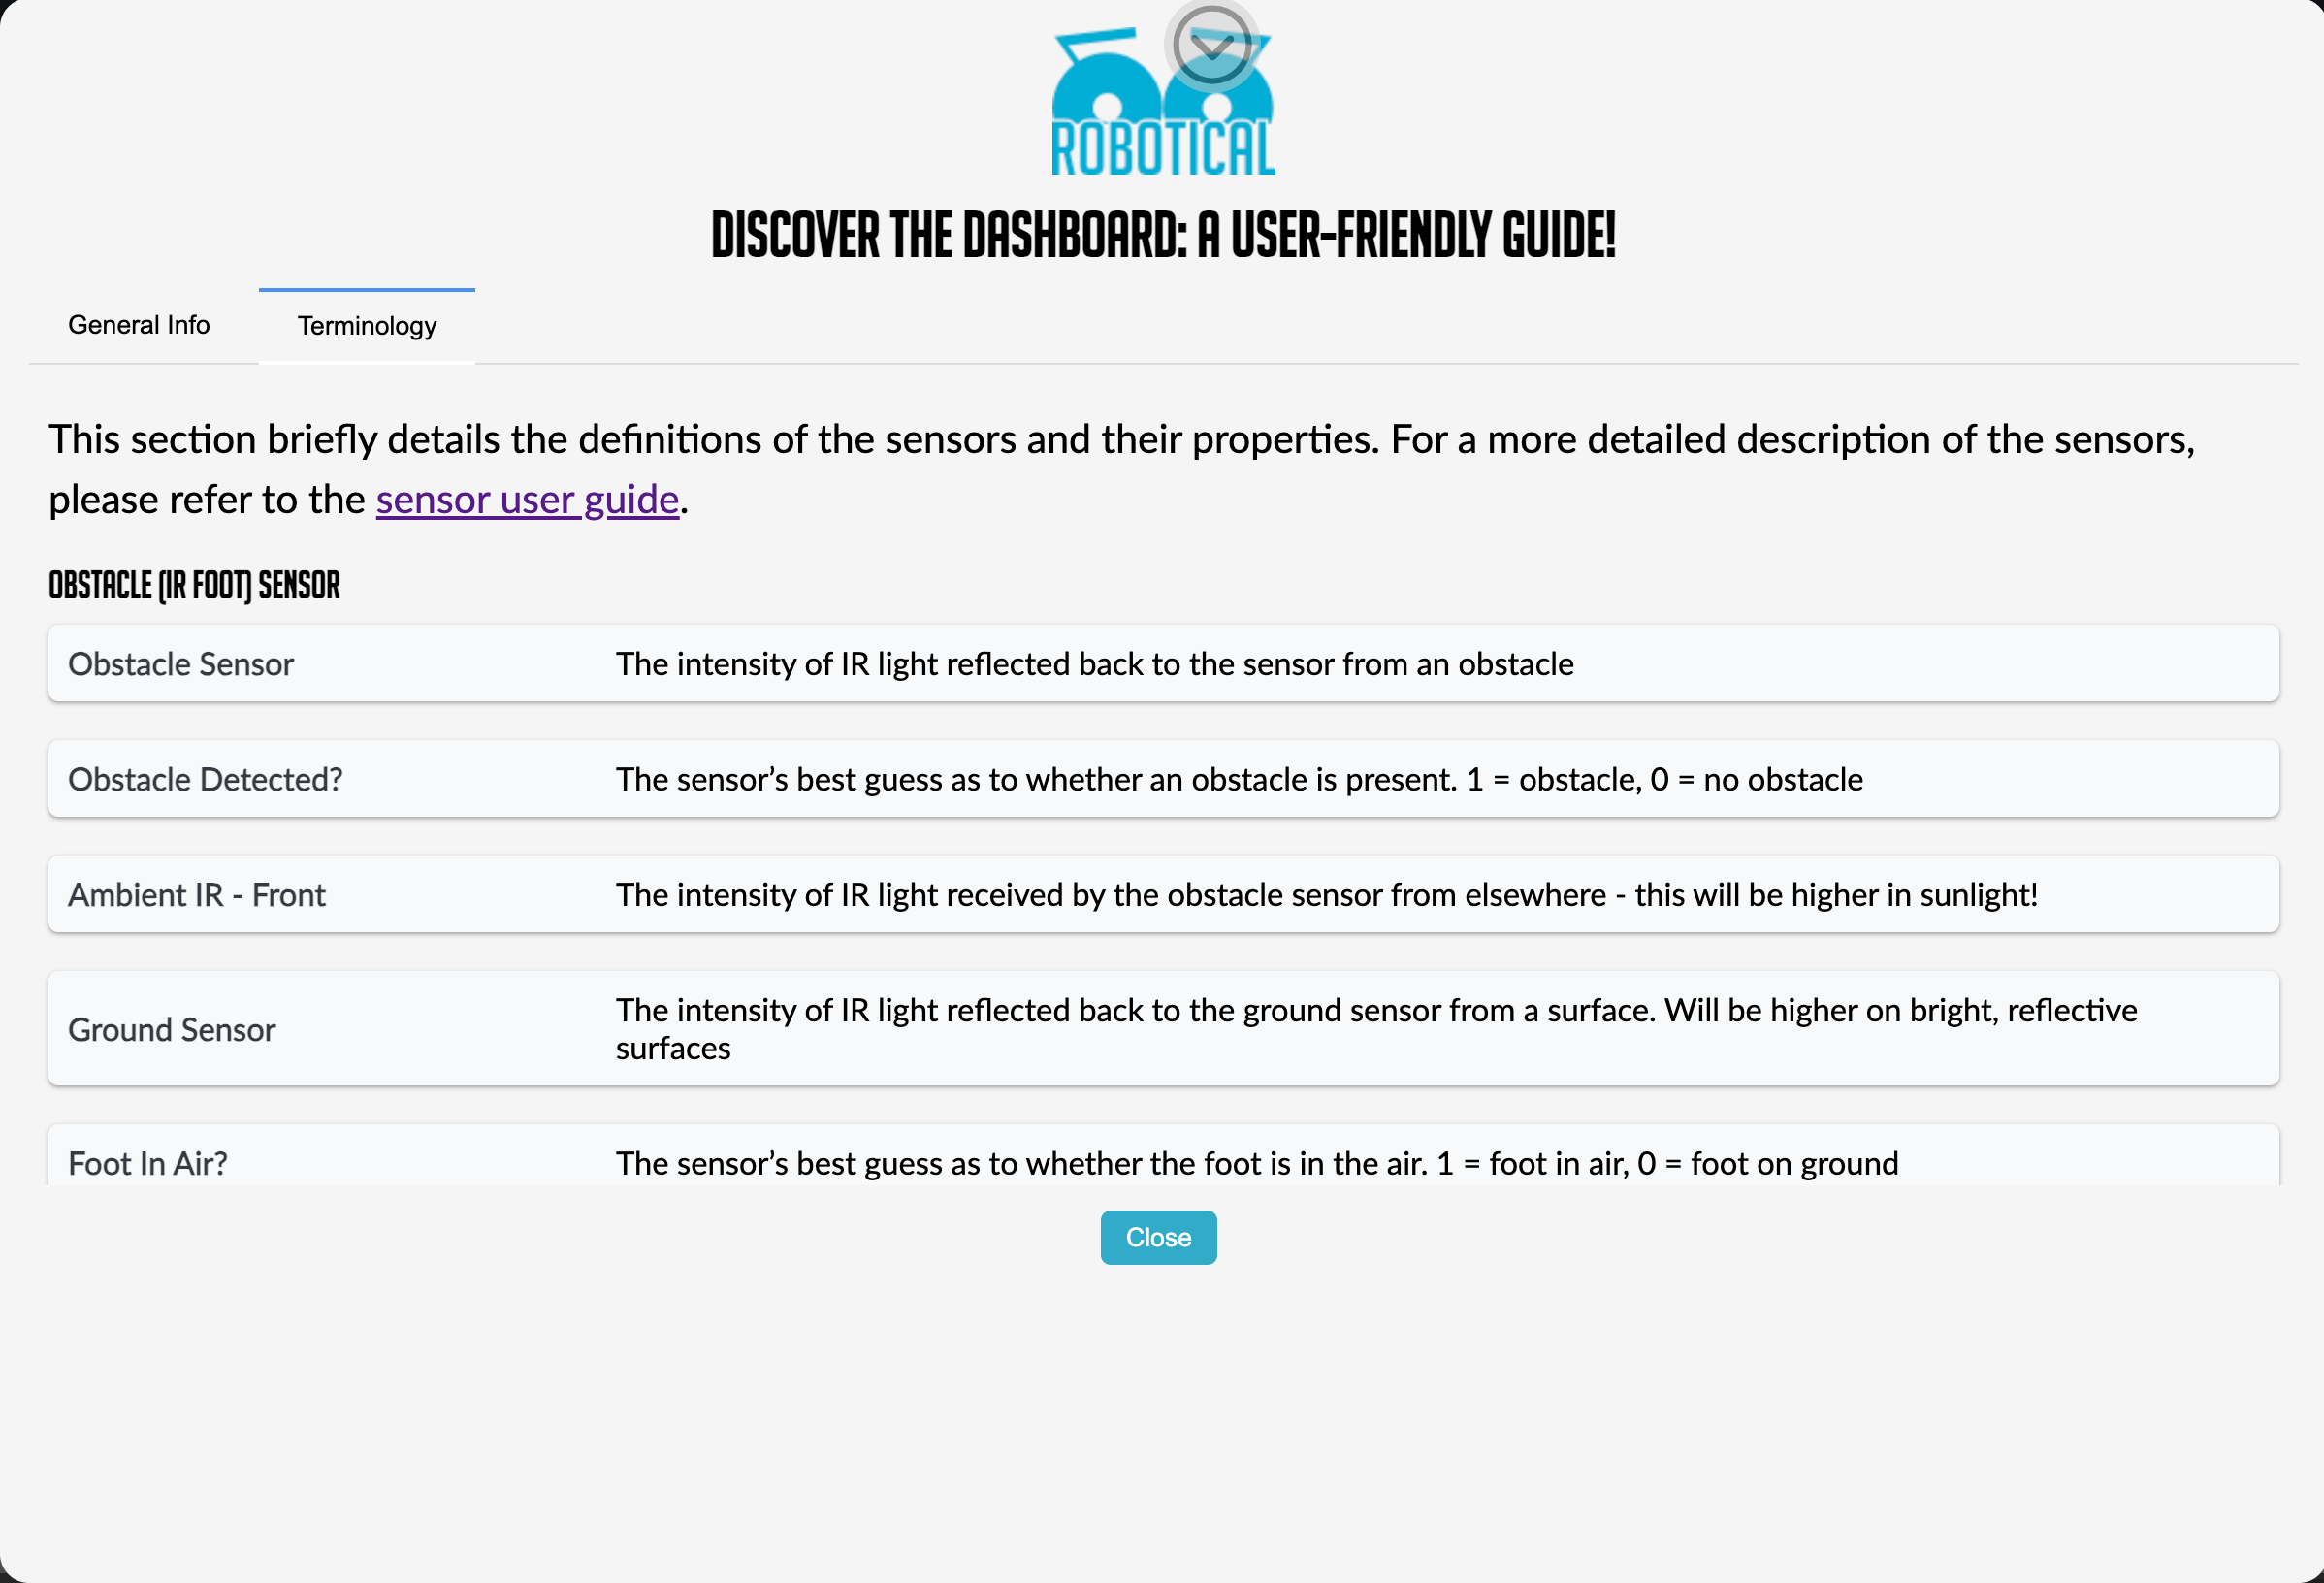
Obstacle (IR Foot) Sensor
- Obstacle Sensor: Reflects the intensity of IR light that returns to the sensor from an obstacle.
- Obstacle Detected?: The sensor's best guess as to whether an obstacle is present or not. 1 = obstacle, 0 = no obstacle.
- Ambient IR - Front: Measures the intensity of IR light received by the obstacle sensor from elsewhere - the reading will be higher in sunlight.
- Ground Sensor: Reflects the intensity of IR light that returns to the ground sensor from a surface. The readings will be higher on bright, reflective surfaces.
- Foot In Air?: The sensor's best guess as to whether the foot is in the air. 1 = foot in air, 0 = foot on ground.
- Ambient IR - Bottom: The intensity of IR light received by the ground sensor from elsewhere.
Color Sensor
- Brightness: Measures the amount of light received by the sensor under the foot.
- Red Channel: Measures the amount of red light received by the sensor under the foot.
- Green Channel: Measures the amount of green light received by the sensor under the foot.
- Blue Channel: Measures the amount of blue light received by the sensor under the foot.
- Obstacle Sensor: Reflects the intensity of IR light that returns to the sensor from an obstacle.
- Obstacle Detected?: The sensor's best guess as to whether an obstacle is present. 1 = obstacle, 0 = no obstacle.
- Foot In Air?: The sensor's best guess as to whether the foot is in the air. 1 = foot in air, 0 = foot on ground.
Noise Sensor
- Recent Noise Level: Measures the average noise level over the last fraction of a second.
- Noise level: Measures the average noise level over the last 100ms.
- Instant Noise Level: Measures the noise level at this instant - it may give higher values than the other options, but could potentially miss some noises.
Light Sensor
- Light Level - Right: Measures the intensity of light from sensor 1, which is to Marty’s right if the light sensor is facing forwards.
- Light Level - Center: Measures the intensity of light from sensor 2, which is in front of Marty if the light sensor is facing forwards.
- Light Level - Left: Measures the intensity of light from sensor 3, which is to Marty’s left if the light sensor is facing forwards.